
RSI in trending and ranging markets needs different context. A reading of 64 on the Relative Strength Index may reflect persistent momentum in a sustained trend; inside a broad range, the same reading may sit near the upper half of the oscillator while price remains bounded. The useful question is what the surrounding price structure says, not whether one number crossed a familiar line.
Why the Same RSI Reading Can Tell Different Stories
RSI compares the size of recent average gains with recent average losses and expresses the result on a 0 to 100 scale. It is calculated from past prices, so it describes recent momentum rather than predicting the next move. Settings matter: changing the lookback or chart interval changes which bars contribute to the reading.
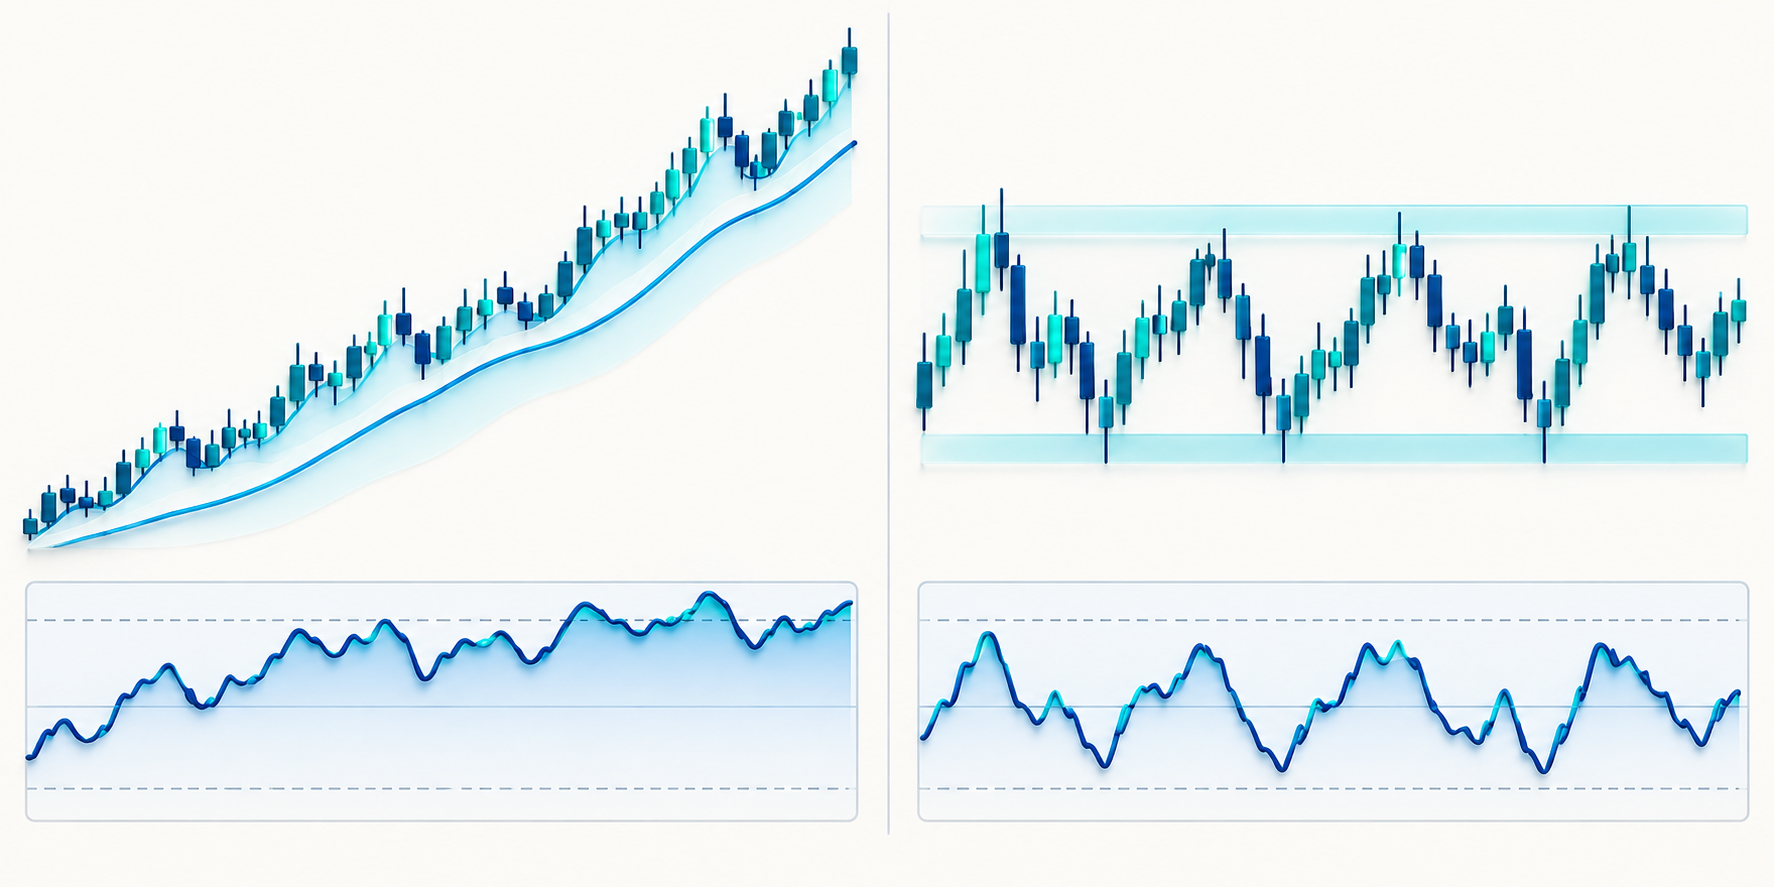
In an orderly uptrend, RSI may spend more time in the upper half of its range and may revisit 40 to 50 without the price trend ending. In a sideways market, price may rotate between visible boundaries while RSI moves back and forth more often. These are observations, not universal thresholds. Confirm the regime from price swings and the chosen timeframe.
A Two-Chart Comparison
Imagine two charts that both show RSI at 68. On the first, successive swing lows are rising and pullbacks hold above prior support. On the second, price has repeatedly failed near the same ceiling and returned to the same floor. The oscillator value is identical, but the structure is not. A short based only on the first reading could oppose a still-rising sequence; a long based only on the second could ignore a range ceiling.
Before comparing readings, make the interval and settings consistent. A 15-minute RSI and a daily RSI summarize different histories. A live candle can also change before it closes, so record whether your rule uses intrabar values or confirmed closes.
Turn Context Into a Testable Question
Write a conditional observation rather than an order instruction: “If the range floor holds on a closing basis, I will reassess the setup; if price closes below it, the range thesis is invalid.” Then decide where the stop belongs and calculate the quantity from the entry-to-stop distance. RSI can help describe momentum at that point; it does not set the stop or the risk budget.
For a simple unit-based example, a hypothetical account risk of $40 and a $2 distance from entry to stop imply at most 20 units before fees and slippage ($40 ÷ $2). That arithmetic is not a suggested risk amount. Contract multipliers, quote currency, and execution costs change the result for derivatives.
What RSI Cannot Settle
RSI alone cannot identify whether a market is trending, define support, establish a reliable reversal probability, or tell you whether a trade is affordable. Test one interpretation on a defined instrument and interval, include fees, and compare it with a no-indicator baseline. Avoid changing settings after seeing the outcome.
For a position whose stop has already been defined, the Position Size & Stop-Loss Calculator estimates quantity from account risk and stop distance. Its result does not validate the RSI reading or guarantee a fill.
Sources and further reading
Educational information only; this article is not investment advice. Futures and perpetual products can result in rapid losses. Exchange rules, fees, contract units, and available products vary. Verify details with your venue before acting.