VWAP Explained: A Practical Reference Point for Intraday Price Context

VWAP is a volume-weighted average over a selected session or anchor. Learn how the reset point changes the line and why crossing it is not a signal.

Explanations of what common technical indicators calculate, how settings and market context affect interpretation, and what each indicator cannot establish.
VWAP is a volume-weighted average over a selected session or anchor. Learn how the reset point changes the line and why crossing it is not a signal.

Read swing structure first, then use volume as context. A higher volume bar can show activity, but it cannot confirm that a breakout will continue.

Use multiple time frames without turning them into competing signals. Assign context, setup, and execution separate roles and define which close controls the plan.

A volume spike means activity differed from a comparison period; it does not identify buyer intent or predict direction. Learn to compare like with like.
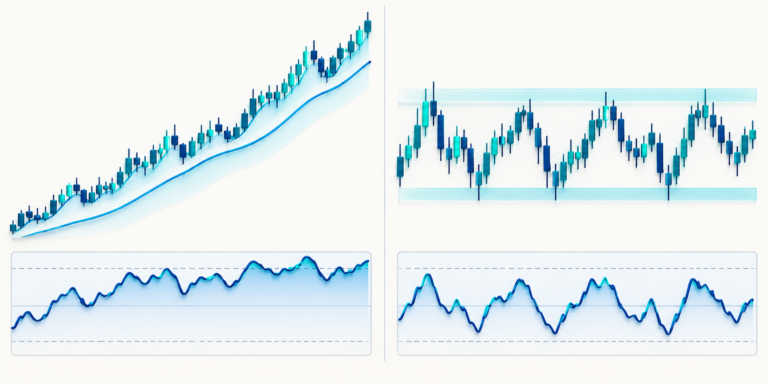
RSI can stay elevated in a trend and swing around in a range. Compare price structure, timeframe, and stop distance before interpreting the same reading.
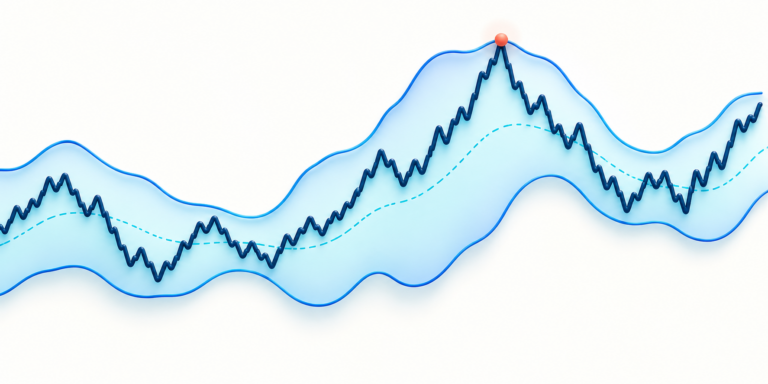
Bollinger Bands show price relative to a moving average and its recent dispersion. Learn why a band touch can continue and why a squeeze has no direction by itself.
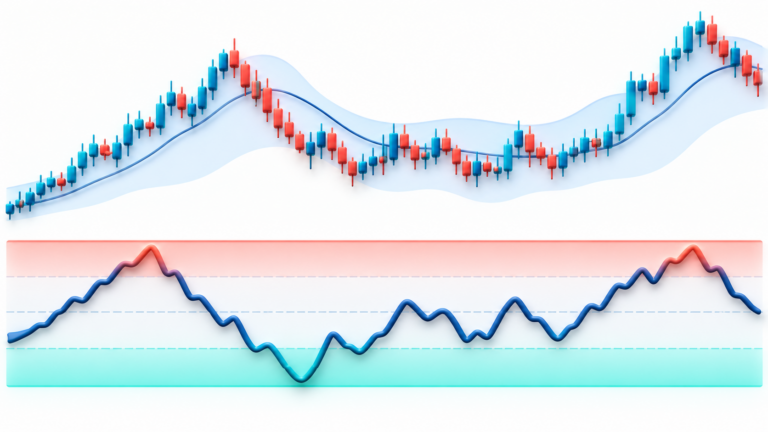
RSI overbought and oversold levels describe recent momentum, not automatic reversal signals. See how the 70 and 30 conventions depend on settings and market context.
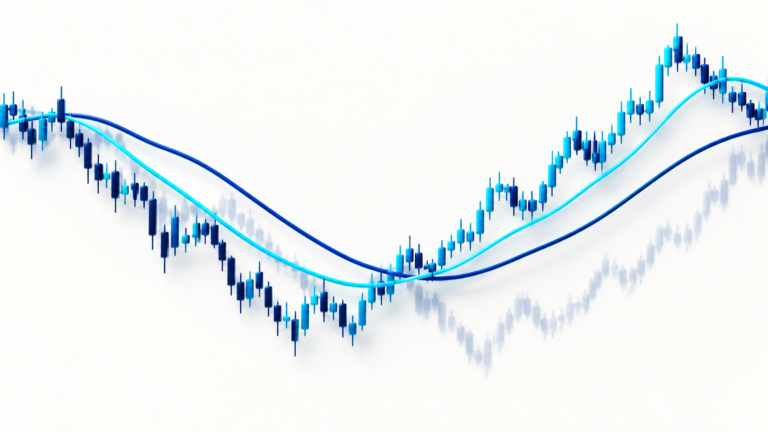
Moving average crossovers summarize past prices and therefore lag. Learn how the average length, chart interval, and range-bound markets affect interpretation.

ADX summarizes directional movement strength but does not identify up or down by itself. Learn how ADX differs from +DI and −DI and why thresholds vary.

The MACD histogram is the difference between MACD and its signal line. Learn what a shrinking bar can show, what it cannot predict, and how settings affect it.