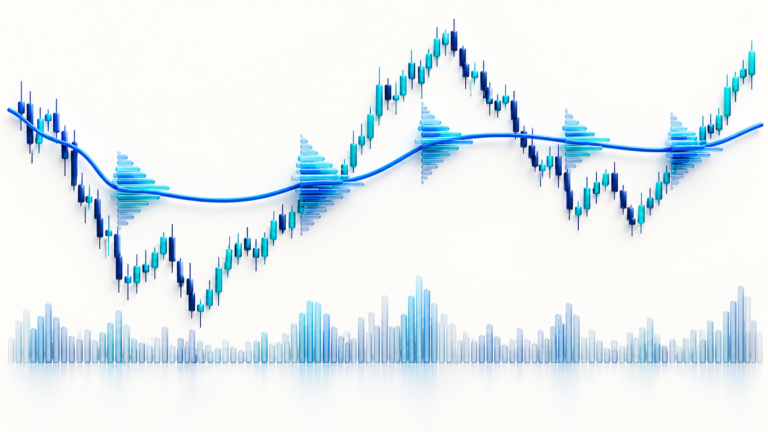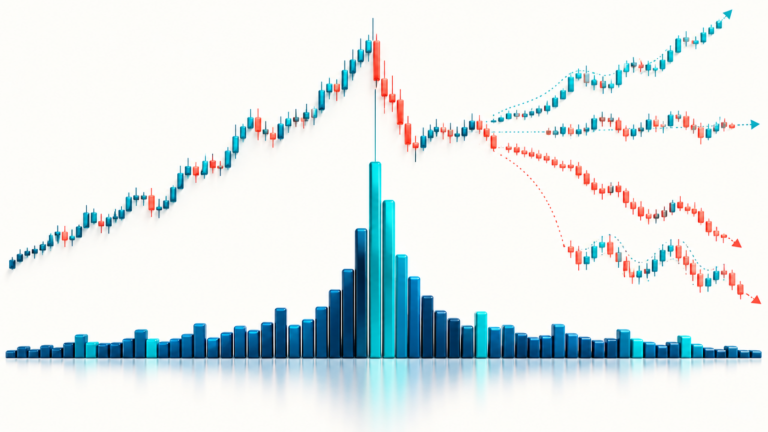

Looking at several chart intervals can add context, but it can also create a moving target: one chart looks bullish, another bearish, and the trader keeps switching until a preferred answer appears. A useful process assigns each interval a defined job before the chart is opened.

Assign Context, Setup, and Execution
A higher interval can describe broader swing structure; a middle interval can define the setup; a lower interval can show how an order might be entered. These roles are not a required formula. The important part is to decide which price condition matters for the thesis and which candle close controls the decision.
For example, a daily chart may show a broad range, while a one-hour chart shows a move toward the range ceiling. A five-minute pullback does not erase the daily range. It only describes a smaller slice of price action. If the position idea depends on a daily close outside the range, an intrabar five-minute move is not equivalent evidence.
Why the Charts Can Seem to Disagree
Each candle aggregates a different number of trades and each indicator is recalculated over that bar set. A moving average or RSI on a lower interval can change several times before the higher interval closes. What appears to be a contradiction may simply be short-term movement inside a larger bar.
To avoid hindsight, record the higher-interval condition and wait for the predefined close. Do not reinterpret the thesis just because the lower interval produced a faster signal. If the higher-interval invalidation is too far away for the account’s risk budget, reduce quantity or pass rather than pulling the stop closer without a reason.
Write a Three-Line Timeframe Rule
Before entry, write: (1) the higher-interval structure and its invalidation; (2) the setup condition on the middle interval; (3) the execution trigger and order type on the lower interval. If one of those conditions is missing, the analysis is unfinished. This simple record also helps identify whether a loss came from the thesis, execution, or a late timeframe change.
Once the entry and stop are fixed, use the position-size calculator to estimate quantity. The calculator does not choose which interval should govern your thesis.
Limits of a Multi-Chart View
More intervals do not necessarily add independent evidence; they often repackage the same price history. Keep the number of charts small enough that each one has a specific purpose, and include exchange costs and liquidation distance in the final risk check.
Sources and further reading
Educational information only; this article is not investment advice. Futures and perpetual products can result in rapid losses. Exchange rules, fees, contract units, and available products vary. Verify details with your venue before acting.