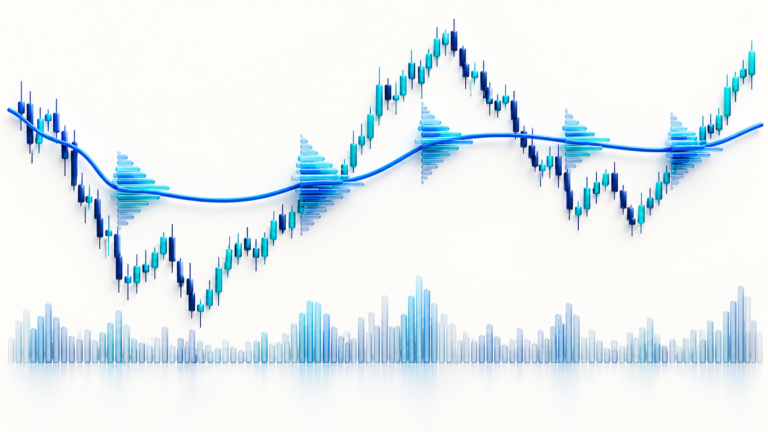

Moving average crossovers occur when one calculated average moves across another. They are easy to mark on a chart after the fact and harder to use consistently because both lines are built from past prices and react at different speeds.
How a Crossover Forms
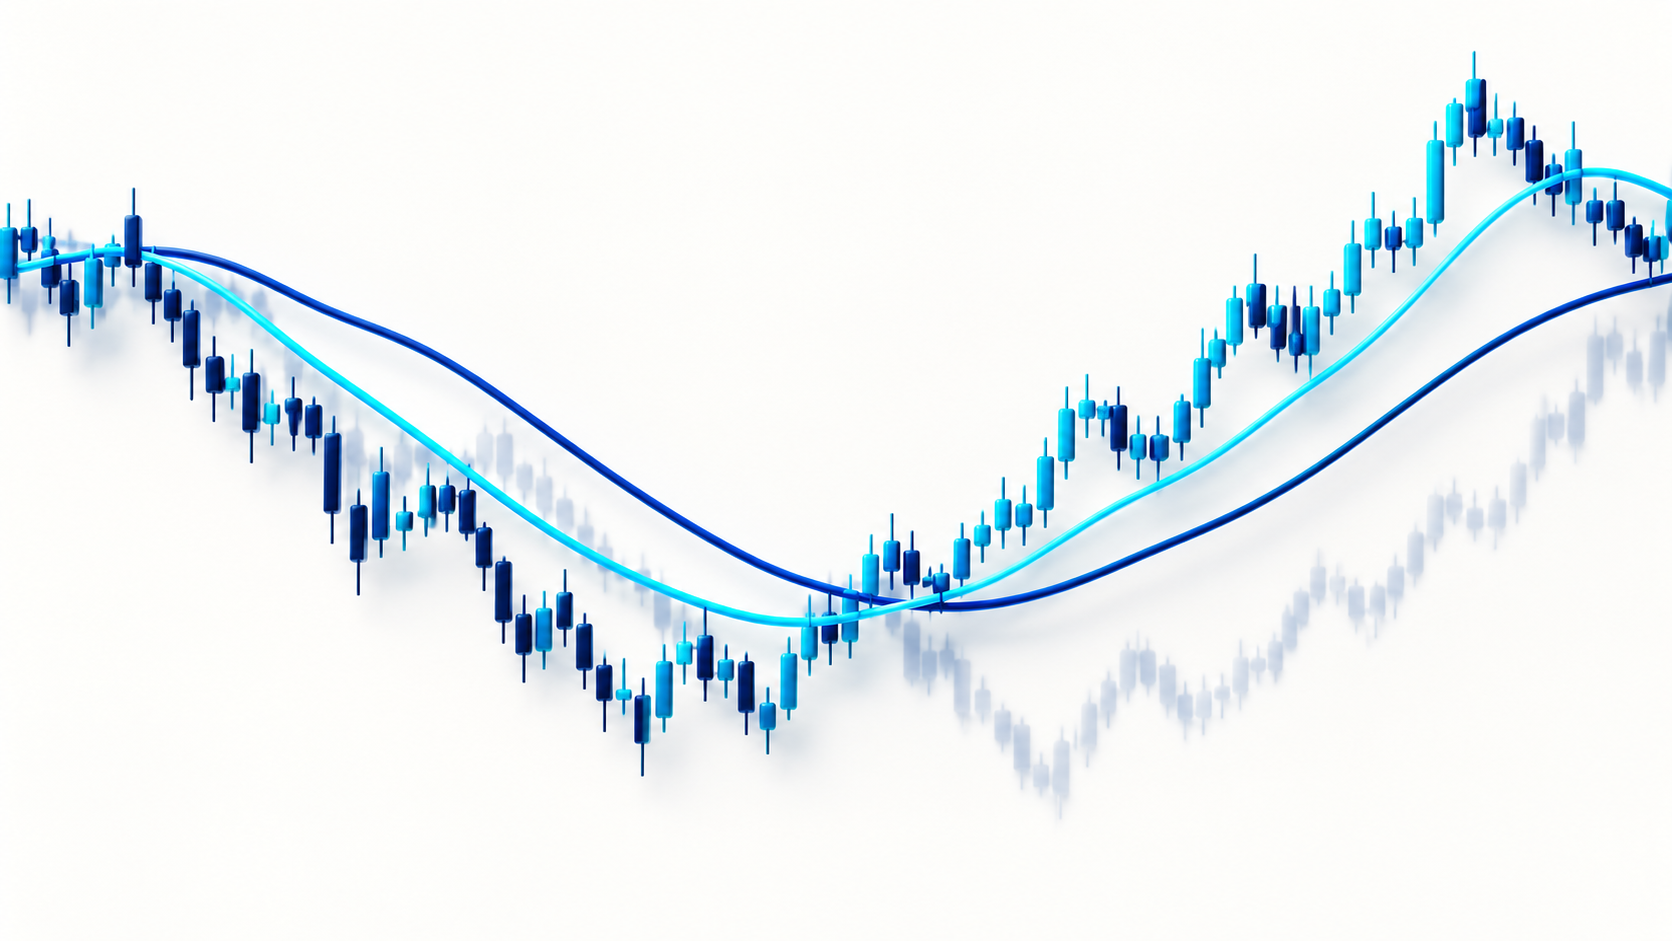
A simple moving average gives equal weight to each price in its selected window. An exponential moving average gives more weight to recent observations. When a shorter average crosses a longer one, the event reflects a change in the relationship between those smoothed histories. It does not identify the exact beginning of a move.
For example, a 10-period average can react sooner than a 50-period average because its window is shorter. The difference can help describe recent direction, but each bar must close and enter or leave the calculation before the line is final. The crossover is therefore a lagging summary, not a leading cause.
Why Ranges Create Repeated Crosses
When price oscillates around a stable area, the short average can repeatedly cross the long average. A rule that treats every cross as a fresh trend may enter late, exit near the next swing, and pay repeated fees. In a sharp trend, the same rule may remain on one side of the longer average but still give back part of a move before the cross reverses.
Before testing a crossover, define the instrument universe, interval, average type and lengths, close-versus-intrabar rule, entry timing, exit rule, fees, and slippage. Changing those details after seeing results turns one test into many unreported tests.
Make the Rule Reproducible
A reproducible rule could say: “Evaluate the 10/50 EMA relationship only after the selected candle closes; record a possible change when the fast average crosses, then check the prior swing structure before deciding whether the setup remains valid.” This example is a review rule, not a recommended trading system. Compare it with a baseline and include periods where it performs poorly.
Separate an observation from a risk decision. If a price-based stop is 4 points away and the hypothetical risk cap is $80, a simple unit calculation gives 20 units before costs. A futures contract may have a tick value or multiplier that changes this arithmetic.
What a Crossover Cannot Tell You
Crossovers do not measure volatility, liquidity, funding, or liquidation distance. A crossover also cannot make one moving-average setting suitable for every instrument. Use price structure and a clear invalidation condition to decide whether the idea still holds, then use the position-size calculator to estimate quantity from risk and stop distance.
Sources and further reading
Educational information only; this article is not investment advice. Futures and perpetual products can result in rapid losses. Exchange rules, fees, contract units, and available products vary. Verify details with your venue before acting.