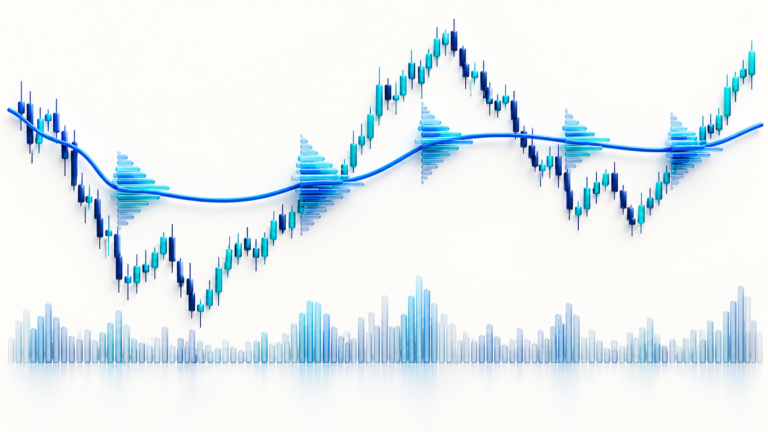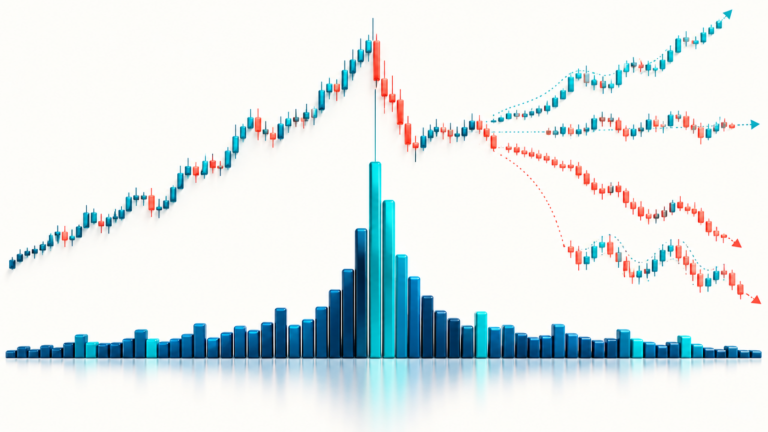

Price structure and volume answer different questions. Swings show how price has moved between turning points; volume records activity under a particular data feed’s definition. Looking at them in that order reduces the temptation to treat one large volume bar as a complete explanation.
Start by Describing the Swings
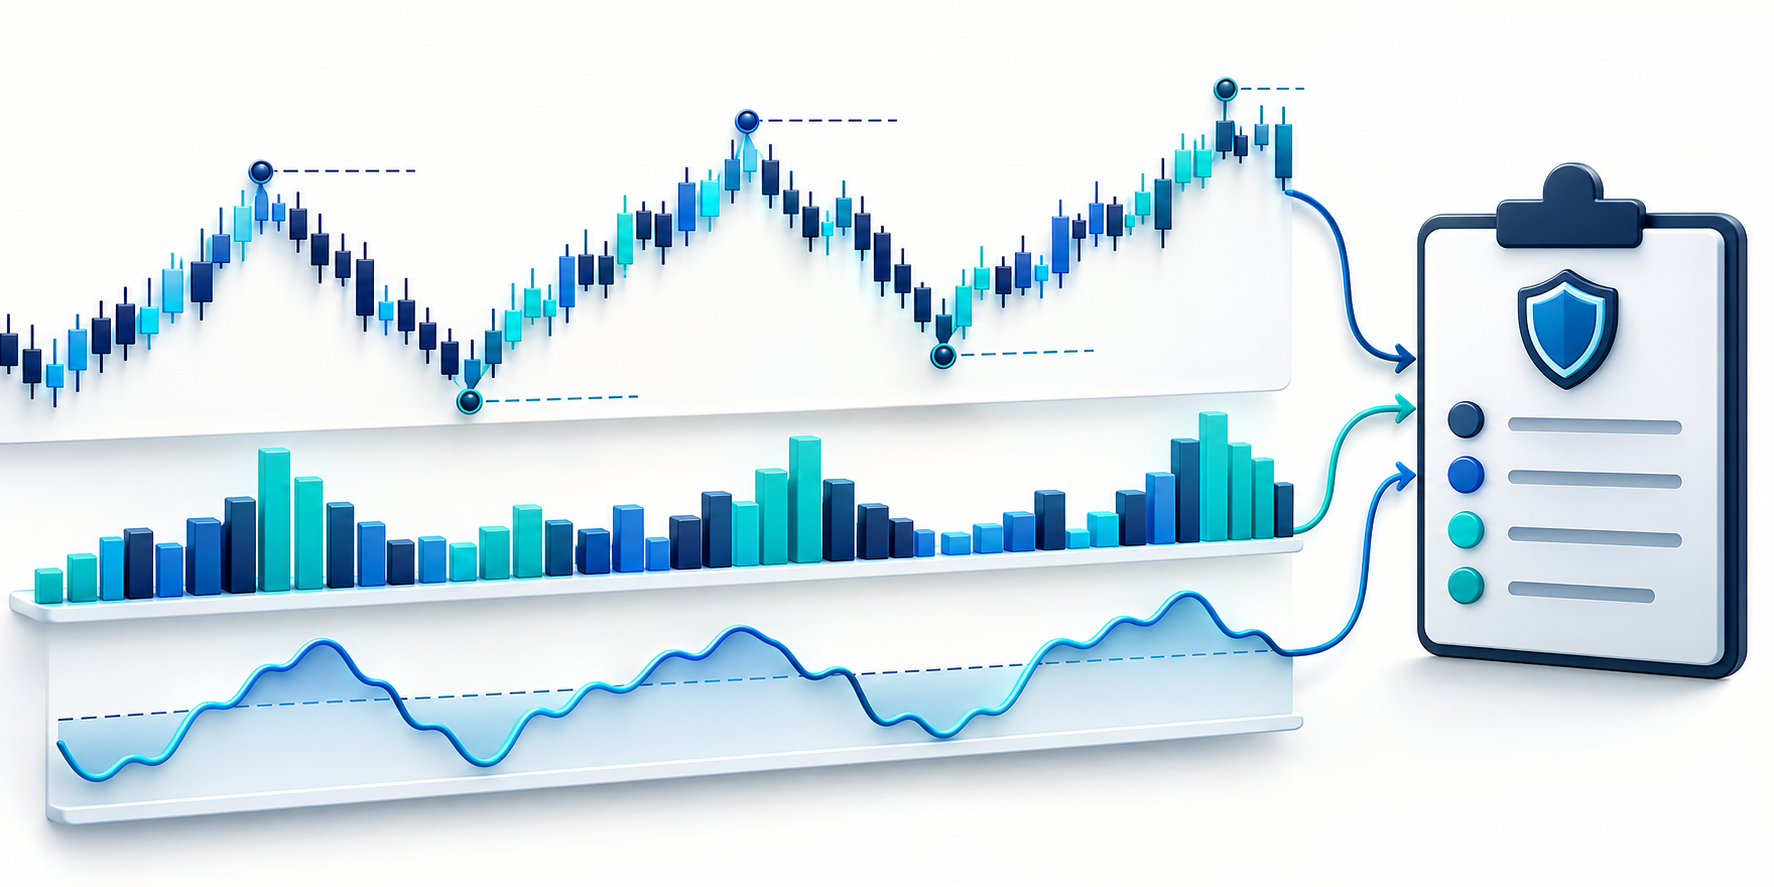
Mark the recent swing highs and lows on one chosen interval. A sequence of higher highs and higher lows is a description of rising structure; lower highs and lower lows describe a different sequence. If the swings overlap and return to the same boundaries, the chart may be rotating rather than trending. These labels summarize observed prices; they do not predict the next swing.
Choose the level that would make your description wrong. A vague statement such as “support should hold” is difficult to test. A specific closing condition below a prior swing low can be reviewed later, even if the resulting trade is not profitable.
Then Ask What Volume Adds
Volume may help compare the activity accompanying two similar price moves. A breakout bar with above-average volume tells you that more activity was recorded than in the selected comparison window. It does not prove that all activity came from buyers, that the price will hold outside the range, or that the exchange’s data covers the broader market.
Compare like with like: same contract, venue, interval, and time zone. In derivatives markets, check whether volume is reported in contracts, base units, or quote notional. If you also inspect open interest, remember that it measures outstanding contracts and can change for reasons that do not reveal which side will profit.
A Worked Review Sequence
Suppose price closes above a three-day range ceiling. First record the close relative to that boundary and the next level that would invalidate the breakout thesis. Then compare the breakout bar’s volume with recent bars from similar sessions. If volume is elevated, note that as participation context; do not upgrade it into a guarantee. If price closes back inside the range, record the failed hold according to the rule you set in advance.
Only after selecting the stop should quantity be calculated. A hypothetical $45 loss budget divided by a $1.50 stop distance yields 30 units before fees, slippage, and any futures multiplier. A wide or fast market can fill beyond the stop trigger.
Avoid Overstating What the Chart Proves
Use language such as “the bar showed higher recorded volume” instead of “institutions bought” unless you have evidence that supports that claim. The position-size tool can help translate a predefined stop into a quantity estimate; it does not validate a price-structure interpretation.
Sources and further reading
Educational information only; this article is not investment advice. Futures and perpetual products can result in rapid losses. Exchange rules, fees, contract units, and available products vary. Verify details with your venue before acting.