
Multiple chart intervals summarize different lengths of price history. They are easier to use consistently when each one has a defined role, rather than treating every new chart as another vote for or against a trade.

Assign Context, Setup, and Execution Roles
A higher interval can describe broad structure and major turning areas. A middle interval can show the setup being evaluated. A lower interval can help specify an execution trigger. These roles are a planning convention, not a requirement. The key is to decide which level invalidates the thesis and not silently replace it with a tighter level from a smaller chart.
Example: Short-Term Weakness Inside a Larger Structure
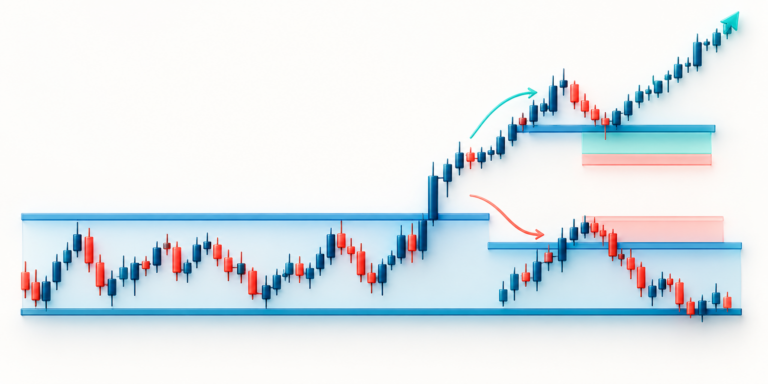
Imagine a daily chart with rising swing lows, a four-hour chart moving sideways, and a 15-minute chart that breaks below its local range. The short-interval break may matter to an intraday setup, but alone it does not prove that the daily structure has reversed. Label what each chart contributes and what event would change the larger view. If the higher-interval stop is too distant for the intended risk limit, reduce quantity or wait rather than pulling that stop closer without a structural reason.
Avoid Cherry-Picking a Convenient Interval
Do not switch chart intervals after the fact until one displays the desired signal. Record interval, candle-close rule, instrument, and price condition. Lower-interval indicators can update several times while a higher-interval candle is still forming, so apparent conflict may reflect different sampling windows.
More Charts Do Not Mean More Independent Evidence
Several intervals are all derived from overlapping price history. They may help describe different levels of detail, but they are not necessarily separate confirmations. Keep only the charts needed to answer a defined question. If the higher interval is still forming, label that context as provisional rather than treating it as a completed signal.
Keep the Risk Calculation Tied to the Thesis
For a hypothetical $40 risk limit, a $2 stop distance allows 20 linear units before costs; a $5 stop allows 8. The smaller chart may refine a trigger, but the larger thesis determines whether that stop is meaningful. Use the position-size calculator after the invalidation level is clear. CME Group’s trade plan worksheet can help document the conditions.
Educational information only; not investment advice. Futures and perpetual products can result in rapid losses. Exchange rules, fees, contract units, and available products vary. Verify details with your venue.