
RSI overbought and oversold levels are labels traders often apply to readings above 70 or below 30. They describe unusually strong recent movement under a chosen calculation; they do not mean price must reverse. The distinction matters most when a threshold is mistaken for a complete entry or exit rule.
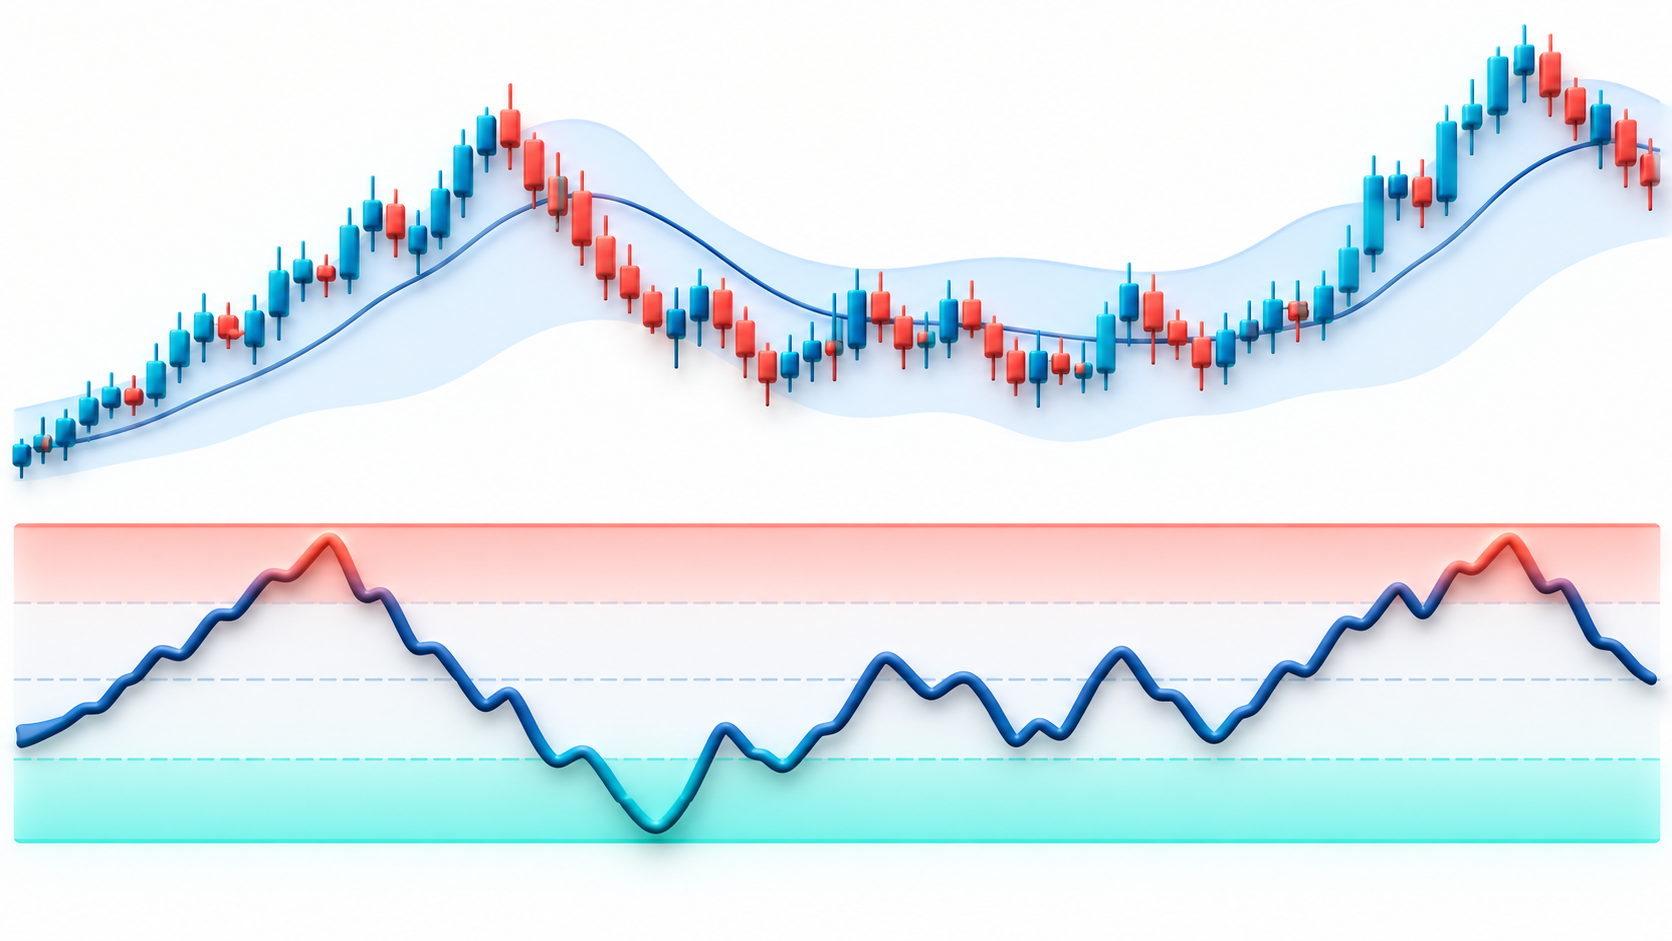
What 70 and 30 Actually Represent
RSI first compares smoothed average gains with smoothed average losses, then maps that ratio to a bounded 0–100 scale. The familiar 70/30 levels are conventions associated with the indicator’s original interpretation. They are not universal constants and do not encode a fixed probability of reversal.
The calculation also depends on lookback length, price source, timeframe, and charting implementation. A 14-bar RSI based on closing prices can differ from a shorter setting or a live candle. When publishing a chart or discussing a threshold, state the settings so readers can reproduce the observation.
Why an Extreme Can Persist
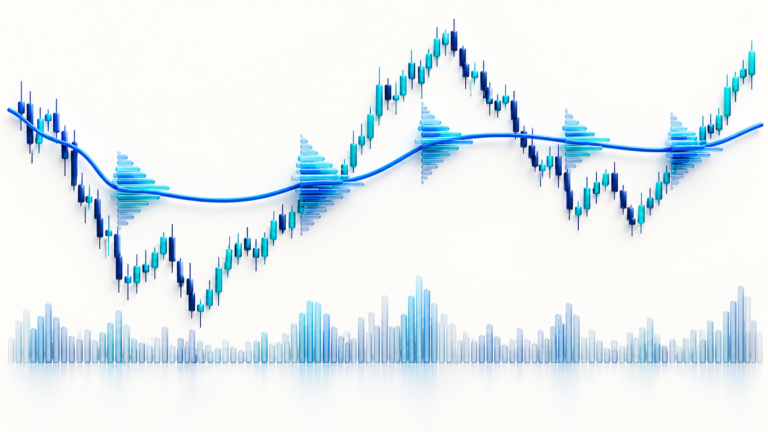
Suppose price advances in a sequence of higher highs and higher lows while RSI rises above 70. The reading says recent gains have outweighed losses over the selected window. It does not say that buyers have finished. In a strong decline, RSI can remain below 30 while lower lows continue. Treating either reading as an automatic fade can place a trade against the very momentum the oscillator records.
In a range, the same thresholds may be more useful as prompts to inspect the range boundary. But price still needs to confirm that the boundary is holding. If a breakout closes outside the range, the old mean-reversion interpretation may no longer fit.
A Better Way to Use a Threshold
Record the threshold as one condition in a written hypothesis: instrument, interval, RSI settings, price structure, invalidation point, and what would cancel the idea. Then compare outcomes over a meaningful sample that includes trading costs. Do not report a handful of chart examples as proof that a threshold has predictive power.
For example, if an entry is considered only after RSI moves back below 70, define whether the rule triggers intrabar or on a close. Those versions can produce different trades. The trigger still does not determine quantity: a $3 stop distance and a fixed $30 hypothetical loss cap imply 10 units before fees, slippage, and any contract multiplier.
Keep the Signal Separate From the Risk Decision
RSI thresholds do not account for leverage, liquidation, funding, or the gap between a stop trigger and its eventual fill. A signal can be technically well-defined and still be unsuitable for a particular account or market condition. Use a price-based invalidation and calculate exposure independently. The position-size calculator can estimate quantity after those inputs are set.
Sources and further reading
Educational information only; this article is not investment advice. Futures and perpetual products can result in rapid losses. Exchange rules, fees, contract units, and available products vary. Verify details with your venue before acting.