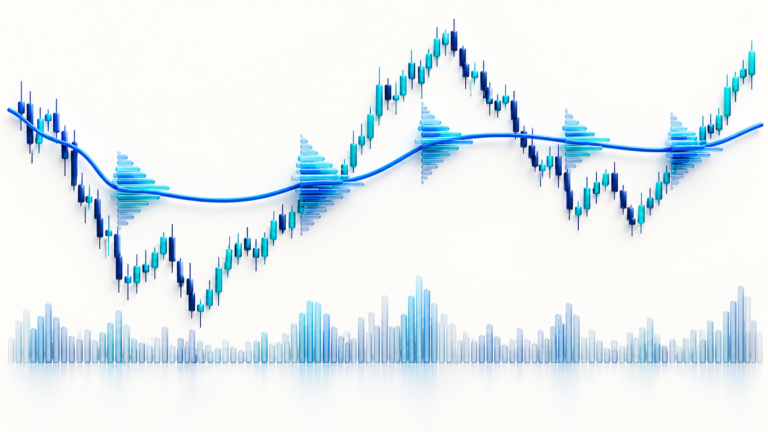

Bollinger Bands place an upper and lower boundary around a moving average. Their width changes with recent price dispersion, which makes them useful for describing volatility. A touch of either band is not, by itself, proof that price is about to reverse.
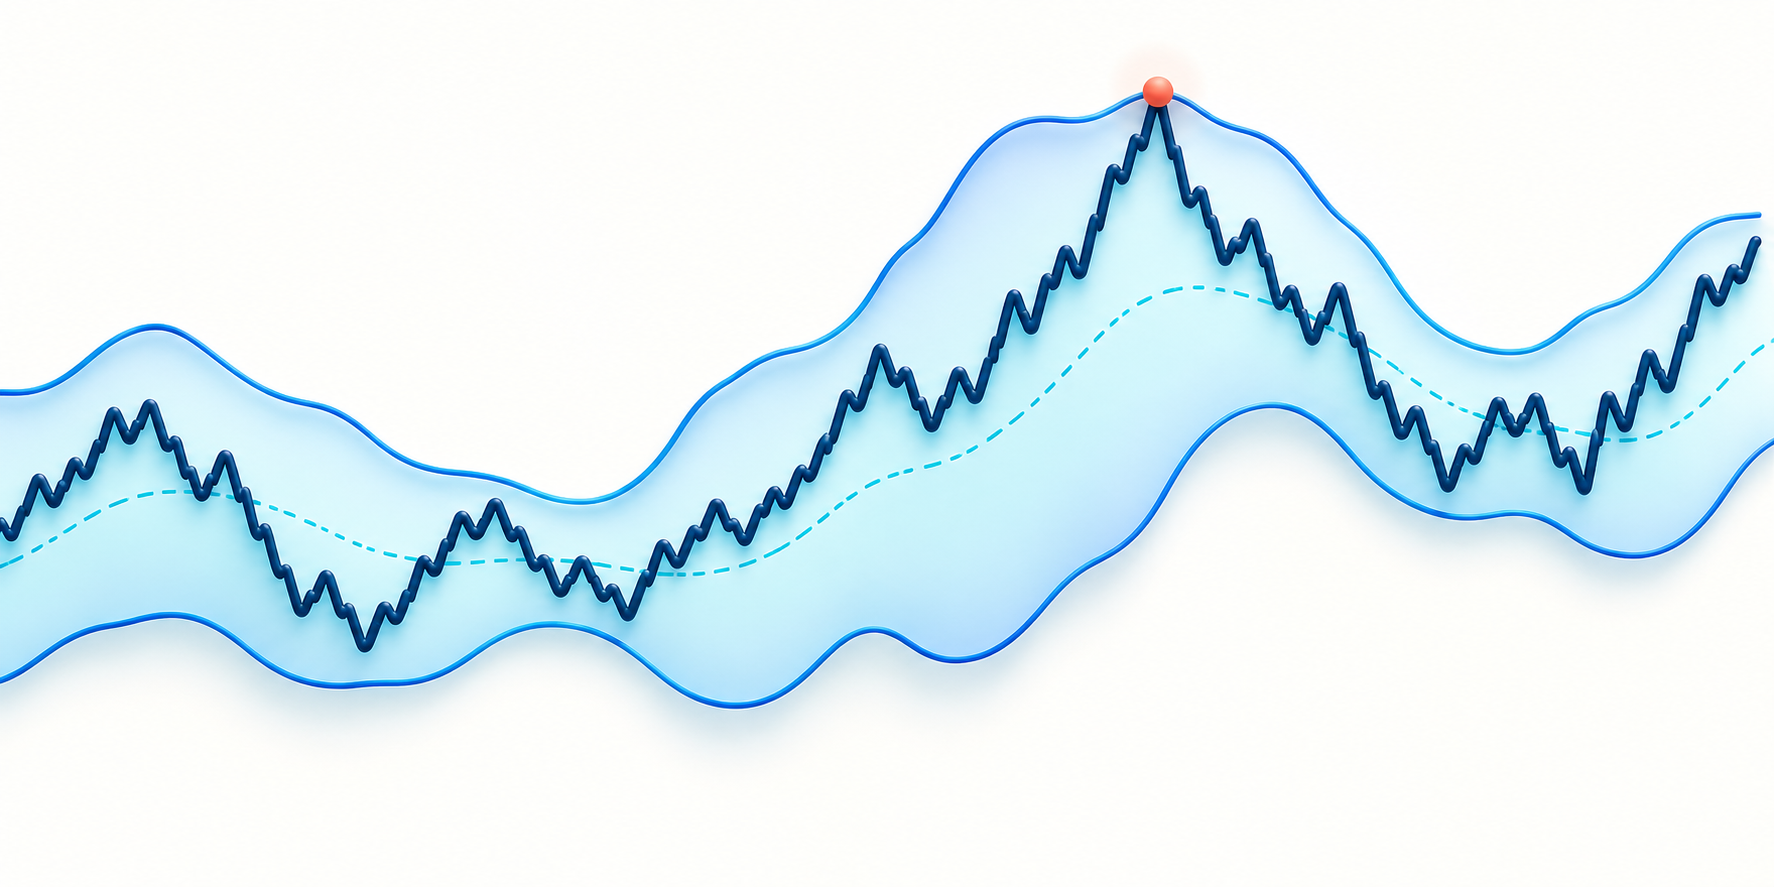
What the Three Lines Represent
A common configuration uses a 20-period simple moving average as the middle line and bands two standard deviations above and below it. These are common defaults, not required settings. Changing the average type, period, or deviation changes the bands and how often price reaches them.
The bands describe relative position within the recent calculation. They do not create hard support or resistance. In a strong move, price can “walk” along an outer band for several bars. Treating the first touch as a fade can oppose a continuing trend.
A Squeeze Shows Narrowing, Not Direction
Suppose the distance between bands contracts over several closes. Recent dispersion has narrowed under the selected settings. That observation may prompt a trader to watch for expansion, but it does not reveal whether the next move will be upward or downward. A breakout needs a direction-specific price rule and an invalidation point.
Similarly, a band expansion after a large candle can be the result of volatility already increasing. It does not guarantee continuation. Compare the close, the preceding range, and any relevant market structure rather than reading width as a forecast.
A Practical Reading
Imagine price closes above the upper band, then closes back inside the next bar. One interpretation is that price briefly extended relative to the recent window; another is that the market is beginning to reject that area. The bands alone cannot distinguish them. A testable process records the close rule, the structure that would confirm or invalidate the idea, and whether the chart interval is complete.
For an educational sizing example, a stop 1.8 units from entry with a hypothetical $36 loss cap yields 20 units before transaction costs. A band width is not automatically an appropriate stop distance; it needs to match the trade thesis and the instrument’s contract rules.
Use Band Width as Context, Then Set Risk Separately
Band width can help compare current volatility with the same instrument’s recent history. It cannot determine quantity or account risk. The Position Size & Stop-Loss Calculator estimates quantity once the entry, stop, and risk budget are selected. Review the result with fees, slippage, and liquidation distance in mind.
Sources and further reading
Educational information only; this article is not investment advice. Futures and perpetual products can result in rapid losses. Exchange rules, fees, contract units, and available products vary. Verify details with your venue before acting.