
The Average Directional Index is often introduced as a trend-strength measure. The key limitation is in its name: the ADX line alone does not say whether the market is trending up or down. Directional context comes from price and, when displayed, the +DI and −DI lines.
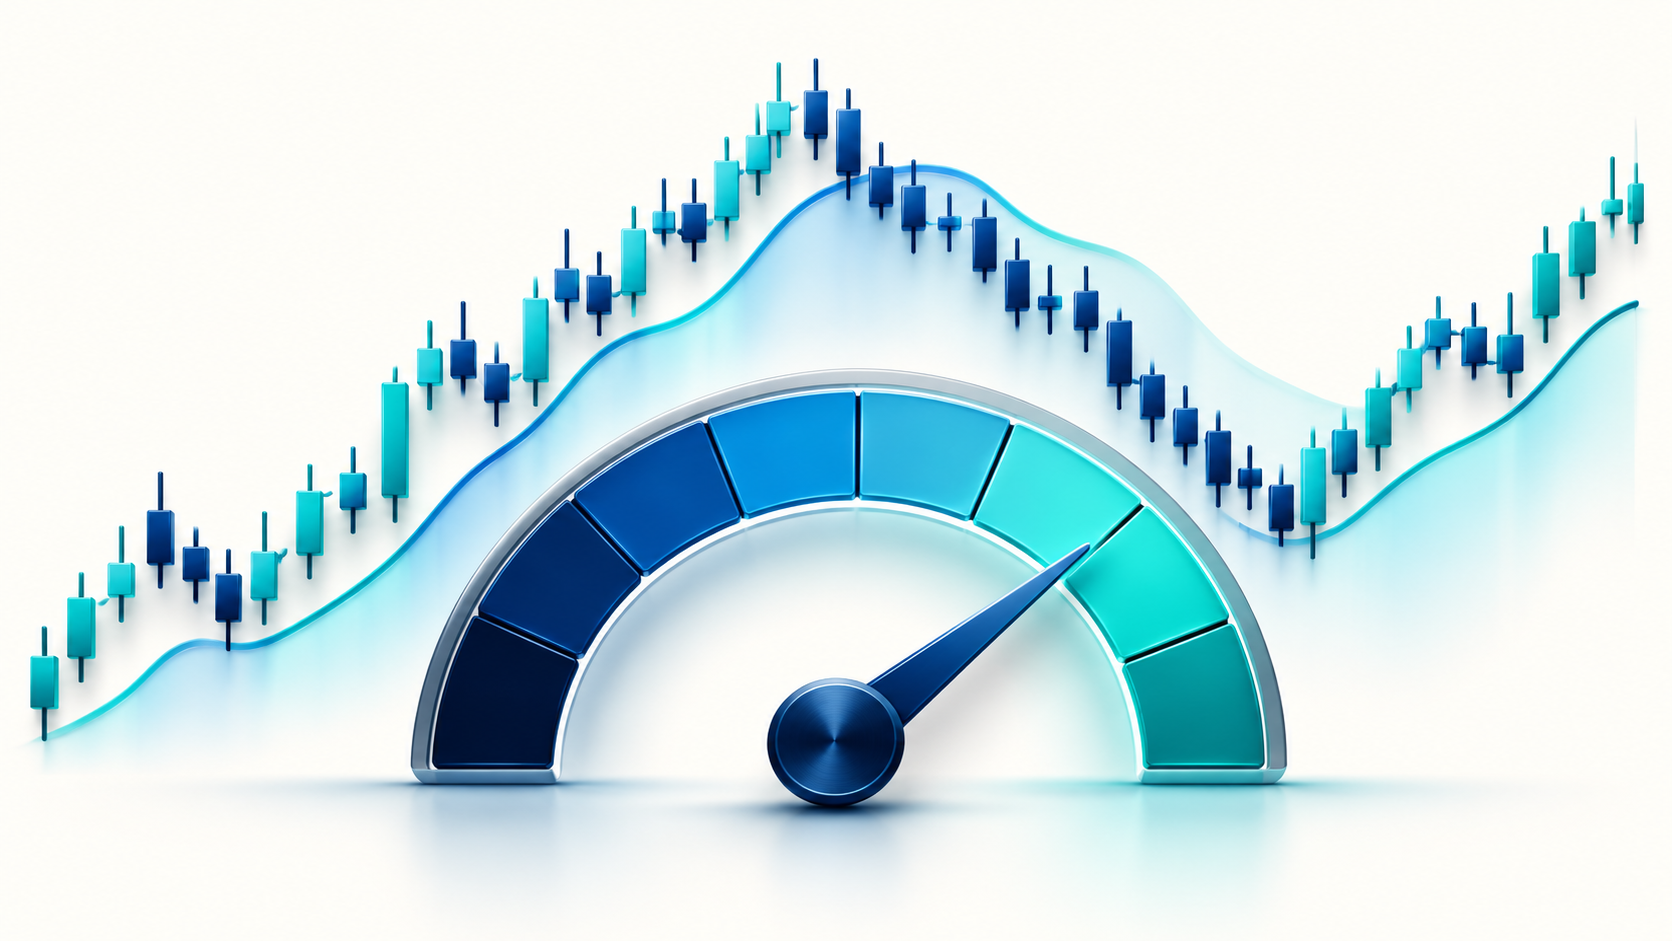
Separate ADX From the Directional Lines
The Directional Movement calculation compares current highs and lows with the previous bar, normalizes movement by a smoothed true range, and derives +DI and −DI. ADX smooths a measure of the difference between those directional indicators. This sequence explains why the line reacts to an established change in movement rather than predicting one before it occurs.
If ADX rises while +DI is above −DI, the indicator set describes strengthening positive directional movement under those settings. If −DI is above +DI, the directional relationship is different. A rising ADX without the DI lines still does not provide direction.
Treat 20 and 25 as Conventions
Some charting references discuss values near 20 or 25 as rough ways to distinguish weaker from stronger trend conditions. They are not universal cutoffs. Instrument volatility, bar interval, lookback length, and implementation affect how often ADX reaches them. A threshold observed on one market should not be transferred as a law to another.
For example, if ADX moves from 17 to 23 while price remains inside a broad range, the line has risen, but the range may still be intact. If the same reading occurs as price breaks a prior swing and +DI remains above −DI, the full picture differs. Neither case guarantees a continuation.
Use ADX to Ask a Narrow Question
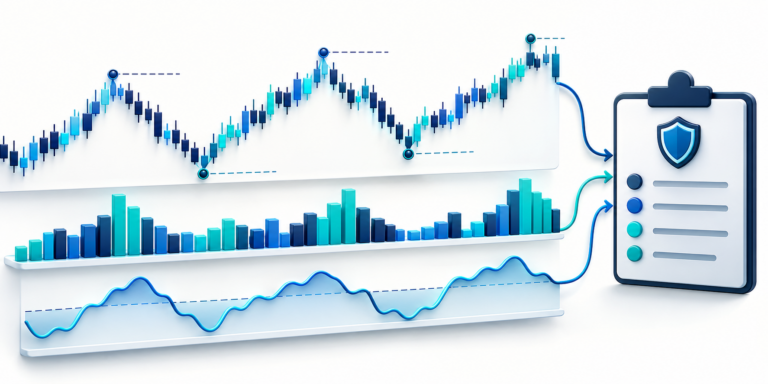
Define the role before viewing a result: perhaps ADX is only a filter that prompts a closer look when movement has strengthened. Then write the price condition that would confirm the trade idea, the level that invalidates it, and the interval on which those conditions are evaluated. Do not treat the threshold as an entry command.
Position size still comes from the loss budget and stop distance. A hypothetical $60 budget with a $3 distance implies 20 units before costs, subject to contract multipliers. Check whether the estimated liquidation level sits beyond the planned stop with a practical buffer.
Limitations to Keep Visible
ADX is smoothed and can lag. It may rise after a large move, remain elevated during a pause, or weaken while price continues. Keep the calculation settings and source visible in any chart review, and compare readings only when the instrument and interval are consistent.
Sources and further reading
Educational information only; this article is not investment advice. Futures and perpetual products can result in rapid losses. Exchange rules, fees, contract units, and available products vary. Verify details with your venue before acting.