
A calculator estimate and an exchange order panel can disagree without either one being broken. One may use simplified inputs while the venue applies its own quantity units, fee tier, maintenance-margin schedule, mark price, and account balance. The useful question is not which number looks better, but which assumptions explain the difference.
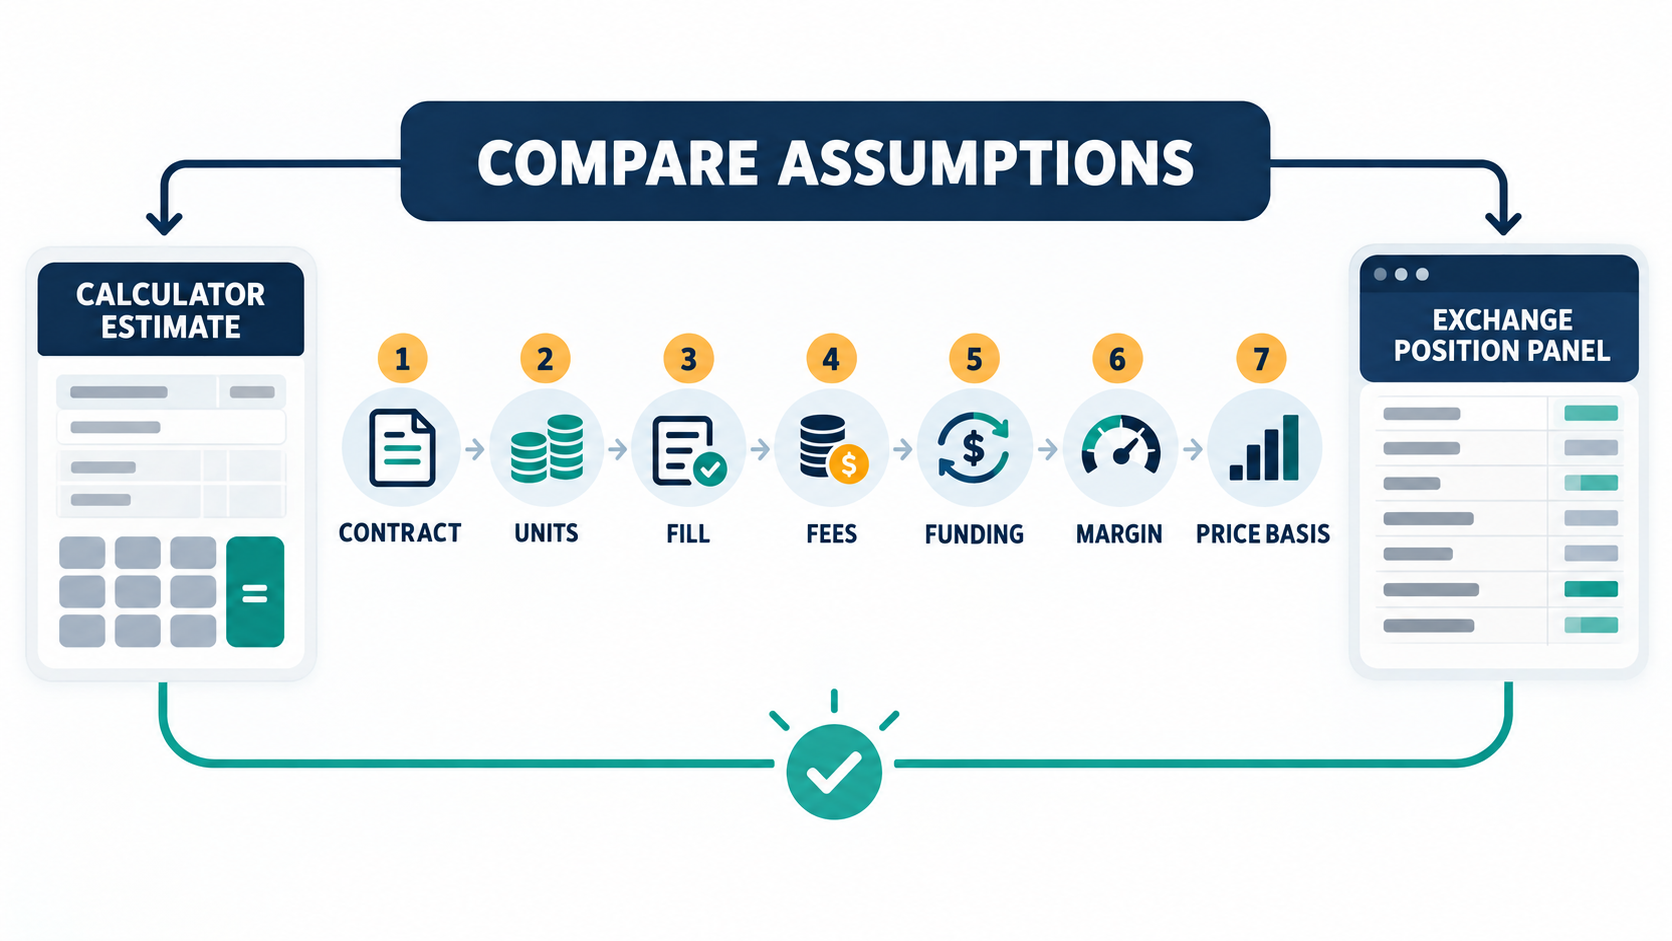
Table of contents
Confirm That Both Tools Model the Same Contract
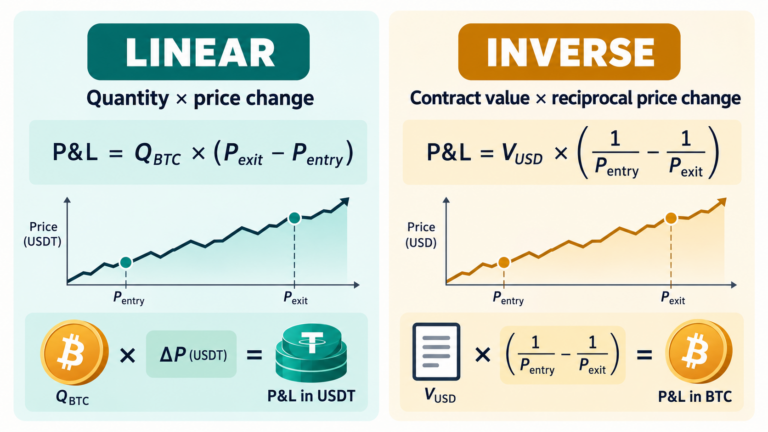
Start with the instrument name and product specification. A linear stablecoin-settled perpetual, an inverse coin-margined contract, and a dated futures contract can use different quantity units and P&L equations. Check the multiplier, quote currency, settlement asset, minimum order increment, and whether the position is one-way or hedge-mode. If the contract model differs, do not expect the same output.
A single specification detail can explain a large gap. If one tool treats one contract as 0.001 BTC while the venue’s contract is 0.010 BTC, the same order of 100 contracts represents 0.1 BTC in one place and 1 BTC in the other: a tenfold difference in notional, in margin, and in the loss at an identical stop distance. Write the multiplier down before comparing any figure.
Match the Actual Position Inputs
Compare entry price, stop or exit price, side, filled quantity, and whether quantity is stated in coins or contracts. Use the actual average fill rather than the intended order price. If an order filled in parts, calculate the weighted average from the fills. Round the calculator’s result down to the venue’s allowed quantity step and rerun the estimate; rounding can change both notional and risk.
The rounding step is easy to underestimate. A risk budget that produces 0.0137 BTC at $48,000 becomes 0.013 BTC on a venue with a 0.001 BTC step: notional moves from $657.60 to $624.00, and the same 1.5% stop distance risks $9.36 instead of $9.86. On a venue with a 0.01 BTC step the same budget would fill only 0.01 BTC, $480 of notional, and the realized risk would fall well below what was planned.
Add Costs and Execution Assumptions
Check whether entry and exit fees use maker or taker rates and whether the rate applies to the notional at each fill. Funding is generally settled at venue-defined times and can change while a position is open; a simple estimate may use a fixed rate and a chosen number of settlements. A stop trigger is not a guaranteed fill price, so fast markets can add slippage. Keep these items separate in the comparison rather than hiding them in a single “profit” number.
Fee tiers alone can move a round trip. On the $5,000 entry and $4,900 exit notional used below, taker fees at 0.05% cost $4.95, while the same trades at 0.075% cost $7.43: a $2.48 difference that a calculator set to one default rate cannot show. Slippage behaves in the same way. A stop that fills 0.2% beyond its trigger on a $5,000 position adds roughly $10 of additional loss before fees.
Compare Margin and Liquidation Separately
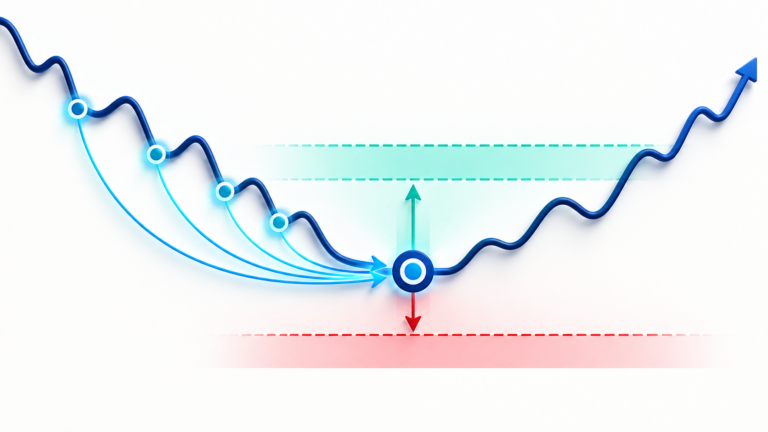
Initial margin is not the same as the loss at a stop. Leverage affects the collateral required for a given notional exposure, while the price move on a fixed quantity determines the simplified gross P&L. Liquidation is another calculation: the venue may apply mark price, maintenance tiers, closing fees, funding, risk limits, and the account’s other positions. A standalone isolated-margin estimate should not be compared directly with a cross-margin position that uses shared equity.
With 0.10 BTC at $50,000 the notional is $5,000. At 10x leverage the isolated initial margin is $500, so a $1,000 adverse move, a $100 loss on the position, consumes 20% of that margin. At 25x the same $100 loss is half of the $200 posted. Compare liquidation figures only after the margin mode, leverage, and maintenance tier match on both sides.
Worked Reconciliation Example
Suppose a hypothetical linear long plans to buy 0.10 BTC at $50,000 and exit at $49,000. A simple gross loss is 0.10 × $1,000 = $100. If the entry fee is 0.05% of $5,000 notional ($2.50) and the exit fee is 0.05% of $4,900 ($2.45), the net loss estimate becomes $104.95 before funding and slippage.
When the two figures disagree, isolate the cause one assumption at a time. Each item below changes the estimate in a predictable direction, which is usually enough to identify it before adjusting any input.
- Quantity unit. Compare the filled quantity multiplied by the contract multiplier on both sides; a decimal place error scales every figure by ten or a hundred.
- Fee tier. Maker and taker rates and VIP levels move a round trip by cents to a few dollars, as the $4.95 and $7.43 examples above show.
- Close-fee reserve. Many venues hold the estimated exit fee at open, roughly $2.45 on a $4,900 exit.
- Reference price. Last, mark, and index prices differ by the current basis, so an identical quantity can display different unrealized P&L.
- Funding count. One settlement is about $0.50 here; three settlements are about $1.49.
- Quantity rounding. The order step can add or remove up to one step of notional, as the BTC examples above show.
If the exchange shows a larger loss, check the quantity unit, the fee tier, and the close-fee reserve first. If it shows a smaller loss, check whether it is displaying unrealized P&L before costs or using a different reference price. Neither outcome proves the calculator wrong; the record of which assumption changed explains it. This calculation does not predict the fill either; it is a transparent baseline that can be compared with the venue’s current figures.
Check the Time and Price Basis Too
If the same hypothetical long pays one 0.01% funding settlement on an average notional near $4,950, the estimated funding debit is about $0.50, taking the simplified total to about $105.45 before slippage. Hold the position through three settlements at that rate and the debit is about $1.49, or $106.44 in total. The real amount depends on the venue’s settlement rules, the rate at each interval, position value at that moment, and whether the position is open when funding is charged. A calculator that assumes one fixed rate cannot reproduce a changing rate history.
Also note whether an exchange panel is showing last price, mark price, index price, realized P&L, or unrealized P&L. A stop may be configured to trigger on one price type while liquidation is calculated from another. The choices are venue- and order-specific, so write the label down instead of comparing two unlabeled numbers as if they were identical.
Keep a Small Reconciliation Record
For each comparison, record the instrument and contract type, position side, actual average fill, quantity and its unit, chosen exit or stop, margin mode, fee tier, funding rate and settlement count, reference price, and the values shown by the exchange with their labels. Keep the record beside the estimate so the next review starts from the same assumptions.
When the numbers still differ, change one assumption at a time. If a different fee tier explains the gap, do not also change the price basis and then claim that the cause is known.
Use the relevant Becofree tool to isolate one component: the Position Size calculator for stop-based quantity, Fee & Funding for a simplified cost scenario, and Liquidation Price only for an isolated linear estimate. These tools do not share live exchange data, and their result is not the venue’s operational value. If the exchange uses inverse settlement, a different multiplier, account-wide cross collateral, or a mark-price trigger, record that as a model mismatch rather than forcing the numbers to agree. Reconciliation identifies assumptions; it does not make an estimate exact.
Seven Checks Before Using the Estimate
- Verify contract type, multiplier, settlement asset, and quantity units.
- Use the actual average fill and the correct direction.
- Apply the same fee tier and maker/taker assumption.
- State the funding rate, settlement count, and funding direction used.
- Separate stop execution and slippage from the trigger price.
- Compare isolated with isolated, or cross with the full account context.
- Treat the venue’s position panel as the operational reference and resolve unexplained differences before placing an order.
For a quantity estimate, use the Position Size Calculator; for a simplified isolated estimate, see the Liquidation Price Calculator. These tools do not connect to an exchange account and do not provide live prices or order instructions.
Educational information only; this article is not investment advice. Futures and perpetual products can result in rapid losses. Exchange rules and account-specific values change; check the current documentation for your venue.