Skip to content
  • Trading
    • Indicators
    • Strategies
    • Risk Management
  • Calculators

B:Economic Freedom

BEconomic Freedom

B:Economic Freedom

  • Trading
    • Indicators
    • Strategies
    • Risk Management
  • Calculators
BEconomic Freedom
  • Indicators

Volume Spikes: How to Separate Participation From Confirmation

A volume spike means activity differed from a comparison period; it does not identify buyer intent or predict direction. Learn to compare like with like.

  • yajirang
  • October 2, 2026
  • Indicators

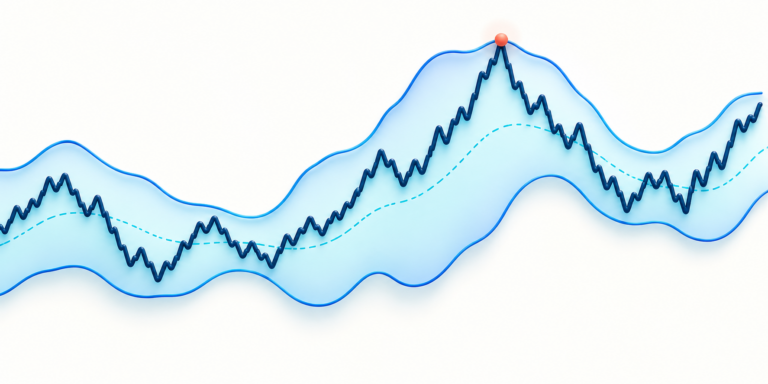
How to Read RSI Differently in Trending and Ranging Markets

RSI can stay elevated in a trend and swing around in a range. Compare price structure, timeframe, and stop distance before interpreting the same reading.
  • yajirang
  • October 1, 2026
  • Indicators

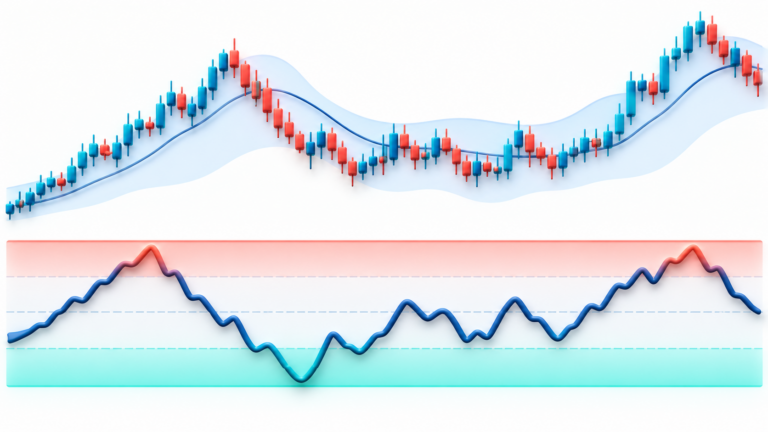
Bollinger Bands and Volatility: How to Avoid Treating Every Touch as a Reversal Signal

Bollinger Bands show price relative to a moving average and its recent dispersion. Learn why a band touch can continue and why a squeeze has no direction by itself.
  • yajirang
  • October 1, 2026
  • Indicators

RSI Overbought and Oversold Levels: Why Context Matters More Than the Number

RSI overbought and oversold levels describe recent momentum, not automatic reversal signals. See how the 70 and 30 conventions depend on settings and market context.
  • yajirang
  • October 1, 2026
  • Indicators

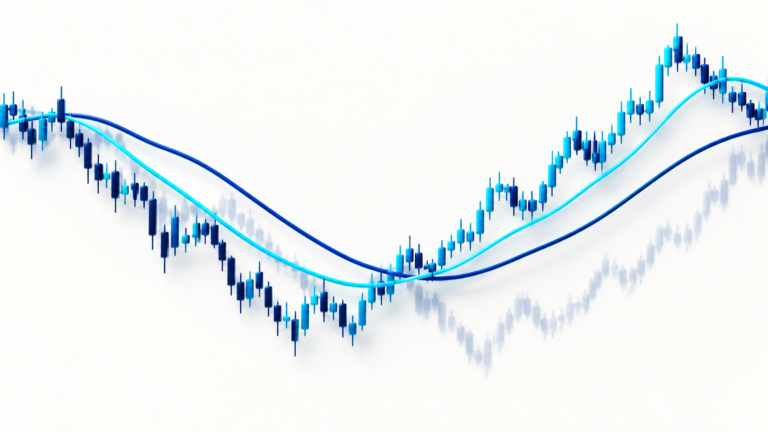
Moving Average Crossovers: Why They Often Lag and How to Use Them as Context

Moving average crossovers summarize past prices and therefore lag. Learn how the average length, chart interval, and range-bound markets affect interpretation.

  • yajirang
  • October 1, 2026
  • Indicators

What the ADX Indicator Measures and Why Trend Strength Is Not Direction

ADX summarizes directional movement strength but does not identify up or down by itself. Learn how ADX differs from +DI and −DI and why thresholds vary.

  • yajirang
  • October 1, 2026
  • Indicators

MACD Histogram Explained: What Momentum Changes Can and Cannot Tell You

The MACD histogram is the difference between MACD and its signal line. Learn what a shrinking bar can show, what it cannot predict, and how settings affect it.

  • yajirang
  • October 1, 2026
  • Strategies

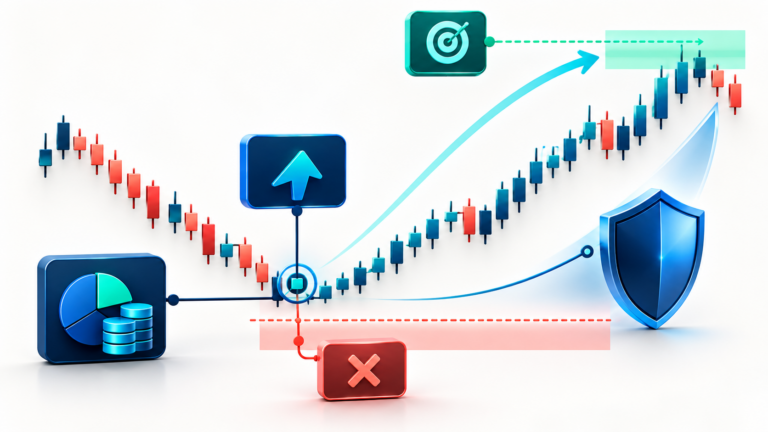
A Simple Post-Trade Review Framework for Finding Repeated Mistakes

Use a repeatable post-trade review to compare planned and actual execution, record costs, and identify process changes without overreading a small sample.
  • yajirang
  • October 1, 2026
  • Strategies

How to Build a Simple Trading Plan Before Entering a Futures Position

Build a simple futures trading plan by defining the entry condition, invalidation level, dollar risk, quantity, and exit process before placing an order.

  • yajirang
  • October 1, 2026
  • Strategies

Limit Orders vs. Market Orders: How Execution Choices Affect Trade Risk

Compare the price control of limit orders with the execution priority of market orders, including partial fills, spread, and slippage risks.

  • yajirang
  • October 1, 2026
Prev
1 2 3 4
Next

Live Search

No results

Posts

How to Calculate Position Size for Perpetual Futures

September 23, 2026

Isolated vs. Cross Margin: What Changes Your Risk?

September 23, 2026

Why Your Liquidation Price Changes After Opening a Trade

September 28, 2026

How to Set a Stop Loss From a Fixed Dollar Risk

September 28, 2026

A Simple Futures Trade Plan: Entry, Stop Loss, Position Size, and Target

September 30, 2026

Categories

  • Indicators
  • Risk Management
  • Strategies

Trending now

How to Calculate Position Size for Perpetual Futures
Isolated vs. Cross Margin: What Changes Your Risk?
Why Your Liquidation Price Changes After Opening a Trade
How to Set a Stop Loss From a Fixed Dollar Risk

Copyright © 2026 - CreativeThemes, Privacy Policy